Data Analytics
Below are some of the data analytics projects I have been working on, if you have any questions or are interested in discussing some of the projects further, please reach out through the Contact page.
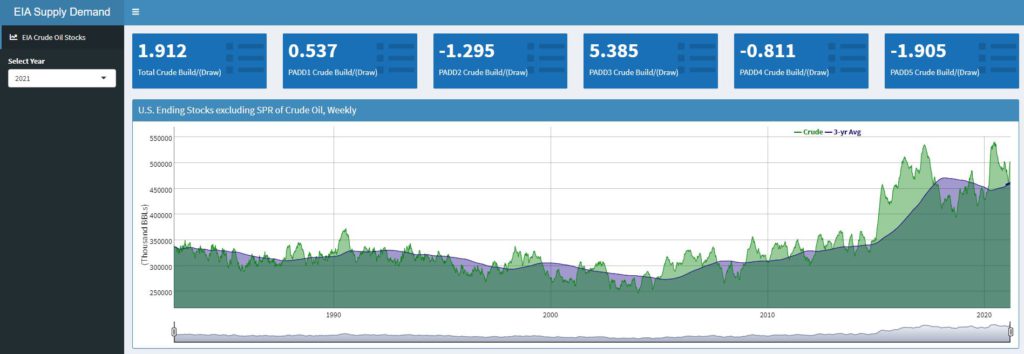
EIA Weekly Storage Dashboard
The EIA Weekly Storage Dashboard is an R Shiny application that visualizes crude oil, Motor Gasoline, Kerosene-Type Jet Fuel, Distillate Fuel Oil, weekly stock data for each PADD. The data is updated automatically every Wednesday shortly after the EIA publishes the initial weekly petroleum status report.
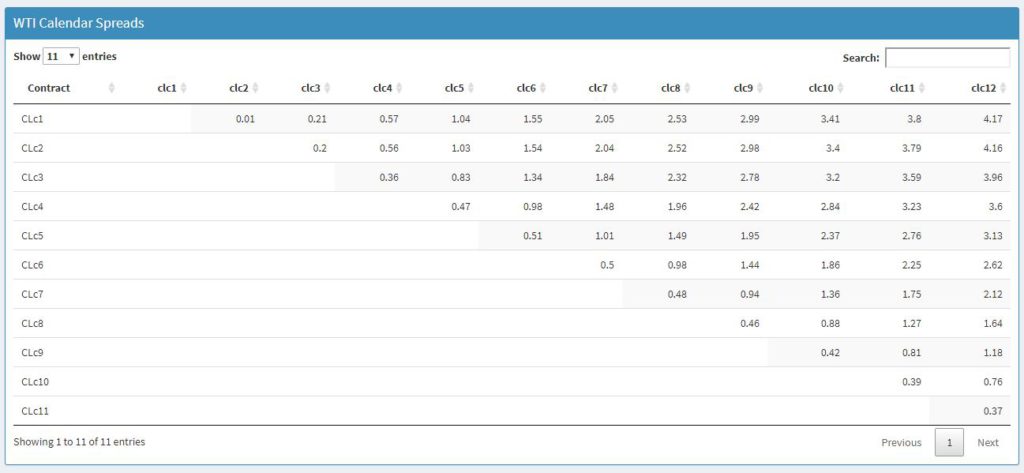
Crude Oil Pricing Application
Crude oil pricing application calculates WTI CMA, contract roll, calendar spreads, forward curves, and historical pricing for NYMEX WTI and Brent crude.
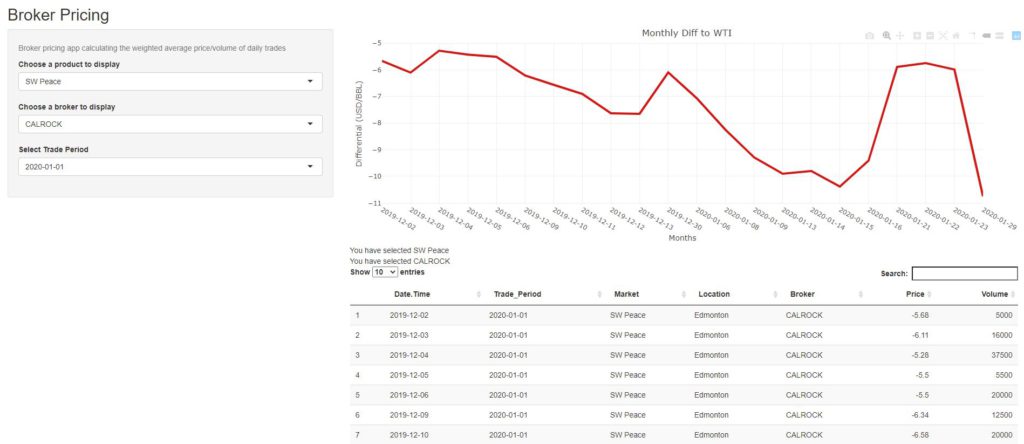
Canadian Crude Oil Broker Pricing
The Canadian Crude Oil Broker Pricing application aggregates the four broker data calculating the weighted average daily price and volume for each crude grade. Due to data terms of use restrictions, live examples of the application cannot be posted.
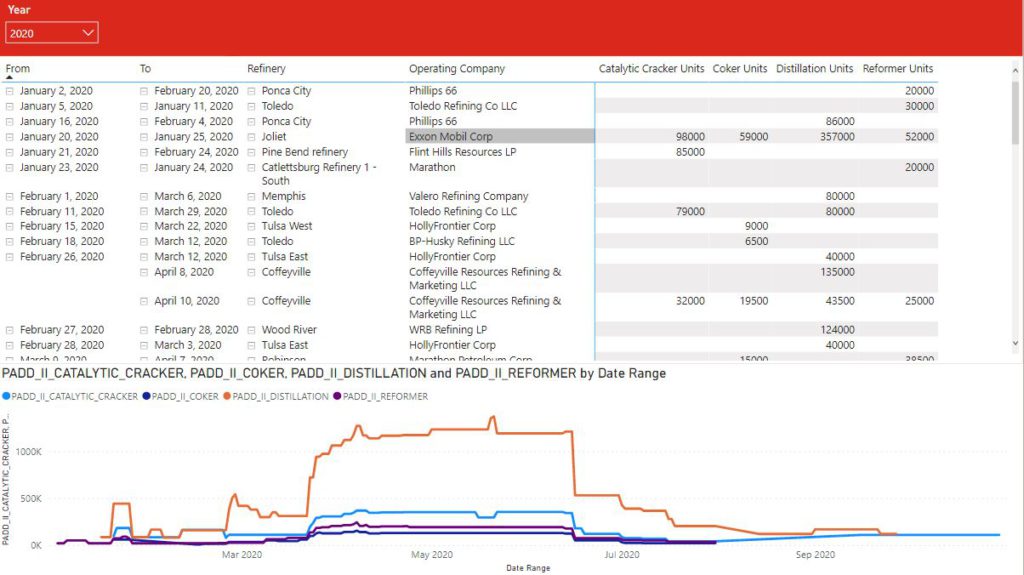
Refinery Turnaround Power BI
The Refinery Turnaround Power BI summarizes outage data for all PADDs and Canada with refinery outage from and two dates clearly labelled with the associated volume impact. Due to data terms of use restrictions, live examples of the application cannot be posted.