R Visuals for Power BI
Importing a visual into Power BI
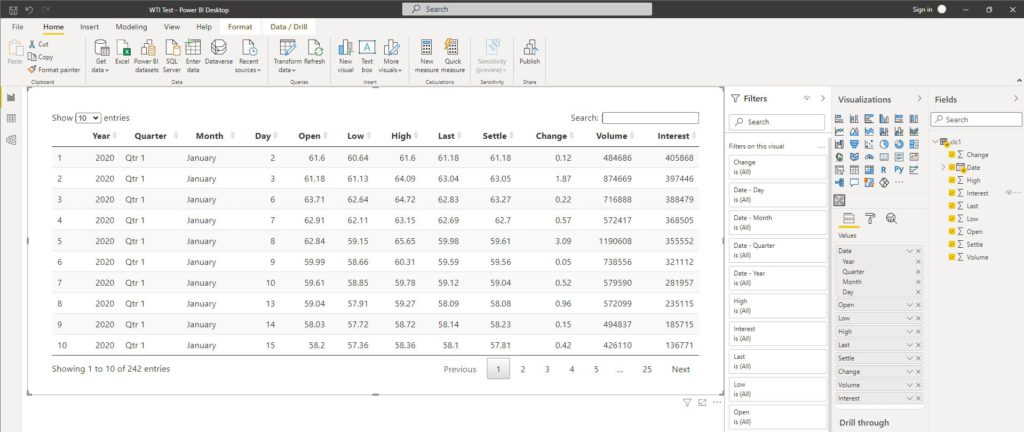
To use the DT Power BI Visual simple download the file and open Power BI Desktop.
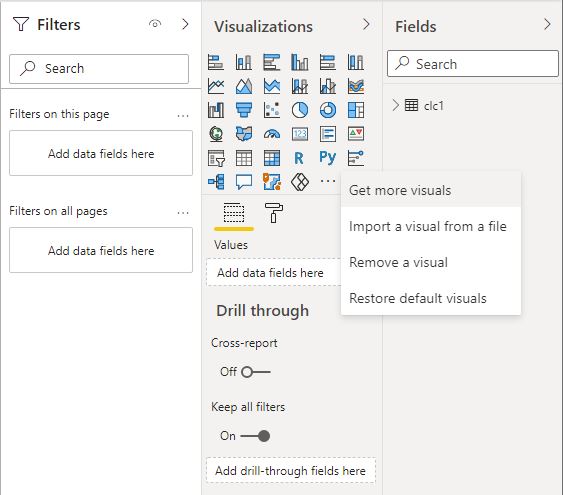
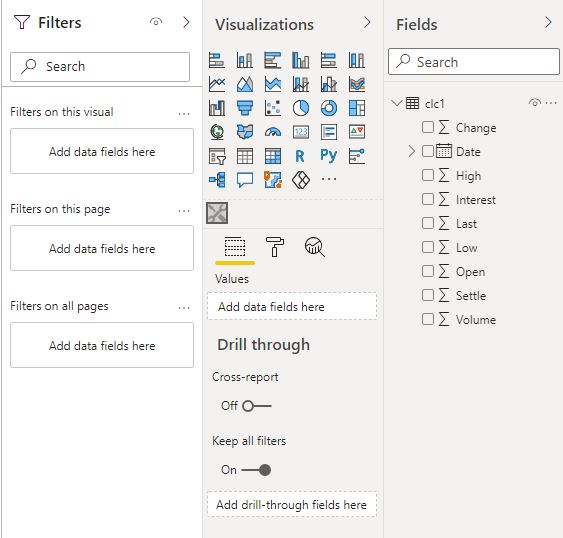
To Import a Power BI visual, in the Visualizations panel on the right side, click the three dots and select Import a visual from a file.
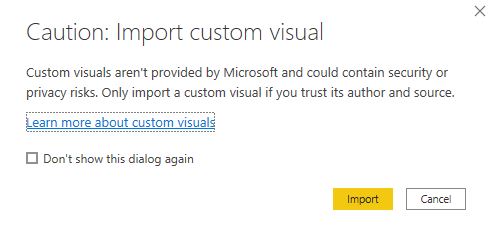
You may see the following warning message, click Import.
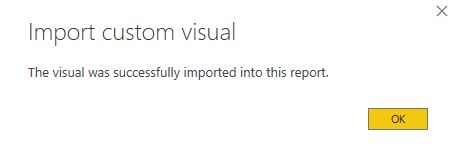
Find the download file in the File Explorer and click Open, you should see the following message upon a successful import.
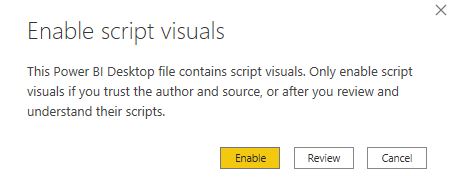
Click the new Visual from the right side Visualizations panel and click Enable, add some data fields and the visualization should populate with some data.
Congratulations you are successfully using custom interactive R visualizations in your Power BI model, check back here for additional visualization packages.